Background
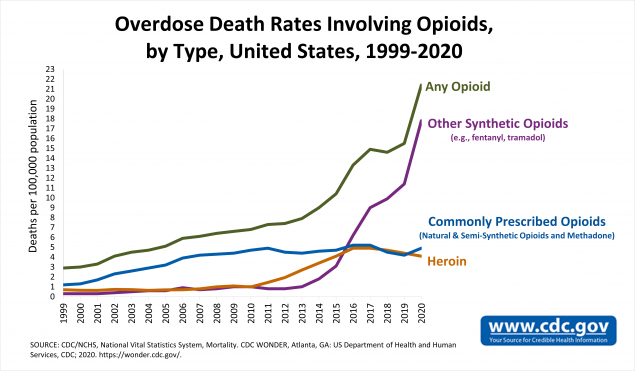
According to data from the CDC, more than 564,000 people died from overdoses involving any opioid — prescription or illicit — between 1999 and 2020. Overdose deaths involving opioids have increased more than eightfold since 1999. Opioids killed nearly 69,000 people in 2020 alone, and over 82% of those deaths involved synthetic opioids.
Purpose
The opioid epidemic highlighted the need to reduce opioid administration in pain management, but there was no established way to track a facility's performance toward that goal. As a Healthcare Data Analyst at Brooks Rehabilitation Center for Data Solutions, I led development of a visual analytics tool — built in SAS Enterprise Guide and SAS Visual Analytics — that accurately tracks and alerts on opioid medication administration at our inpatient rehabilitation facility. The tool was rolled out alongside clinical processes aimed at reducing opioid administration, and it now validates hospital-wide progress on that initiative.
Methods
Medication data for 3M+ administrations were extracted from our EMR for inpatient rehabilitation patients from January 2019 through March 2021. Several transformations were required before analysis.
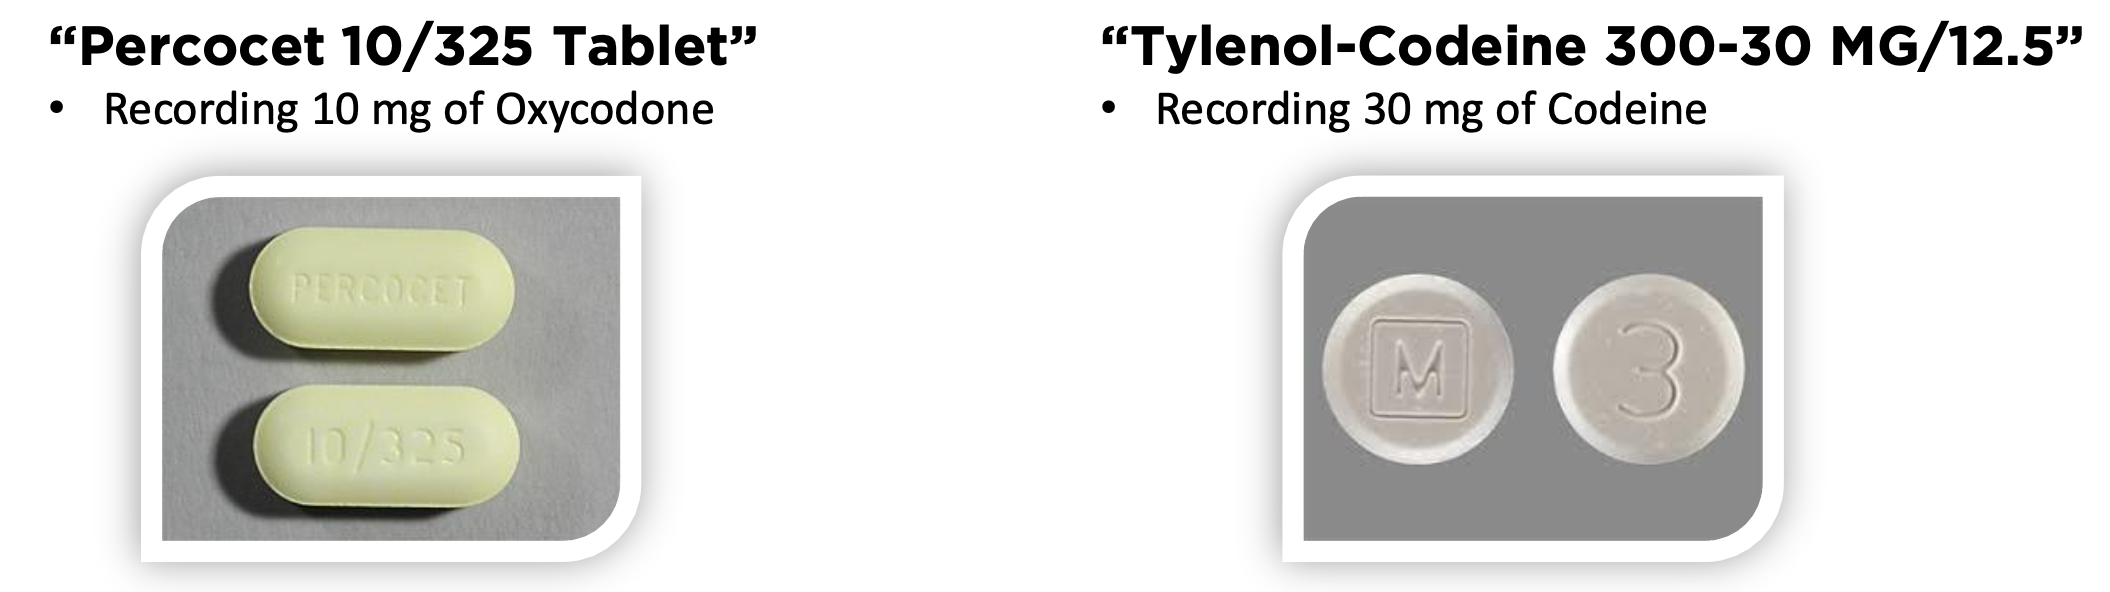
Many administered medications were compound medications — a mix of active drugs. Since the project's focus was opioid administration specifically, the opioid component dosage was extracted from each. For example, a Percocet 10/325 mg tablet contains 10 mg of oxycodone (an opioid) and 325 mg of acetaminophen (not an opioid), so only the 10 mg of oxycodone was recorded as a new field.
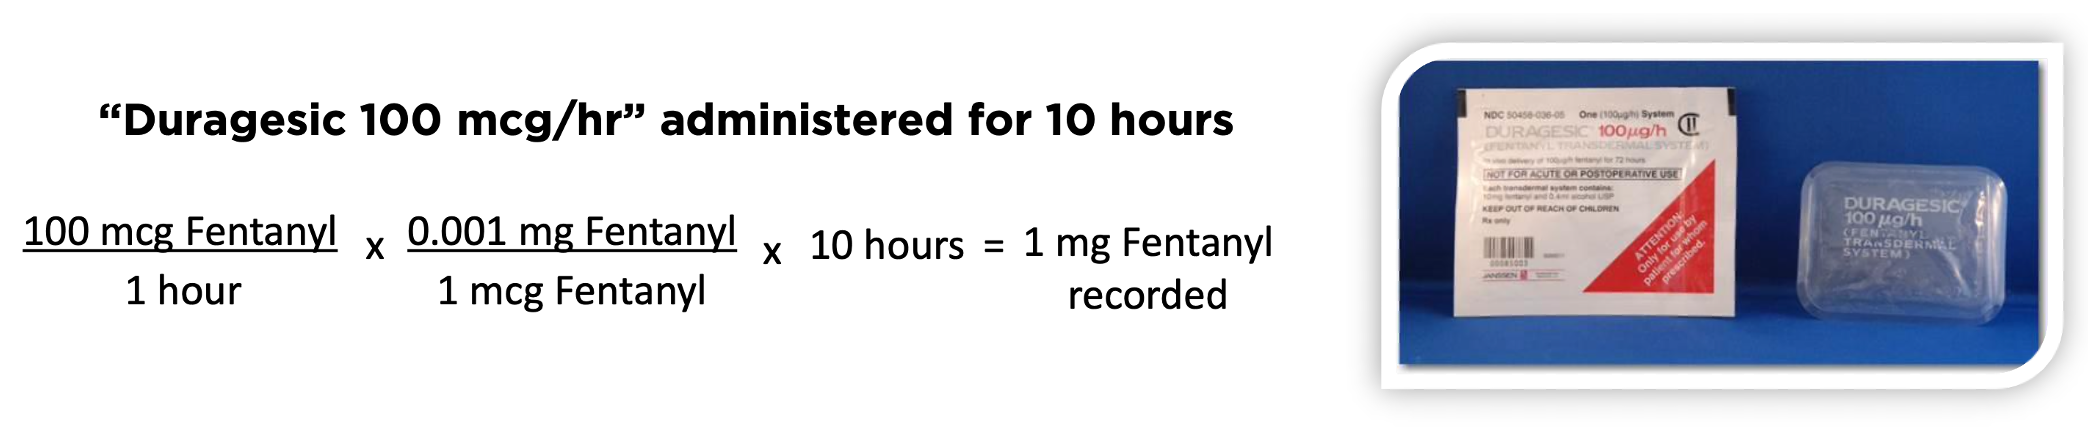
Some opioid medications are administered via a transdermal patch rather than a pill. For that route, wear duration directly affects the dose received, so dose was calculated as dosage rate × administration duration.
Because opioid medications vary widely in potency (1 mg of oxycodone is roughly 1.5× stronger than 1 mg of hydrocodone, for example), all dosages were converted to morphine equivalents — a standardized measure of opioid potency relative to morphine — using conversion factors based on CDC guidelines.
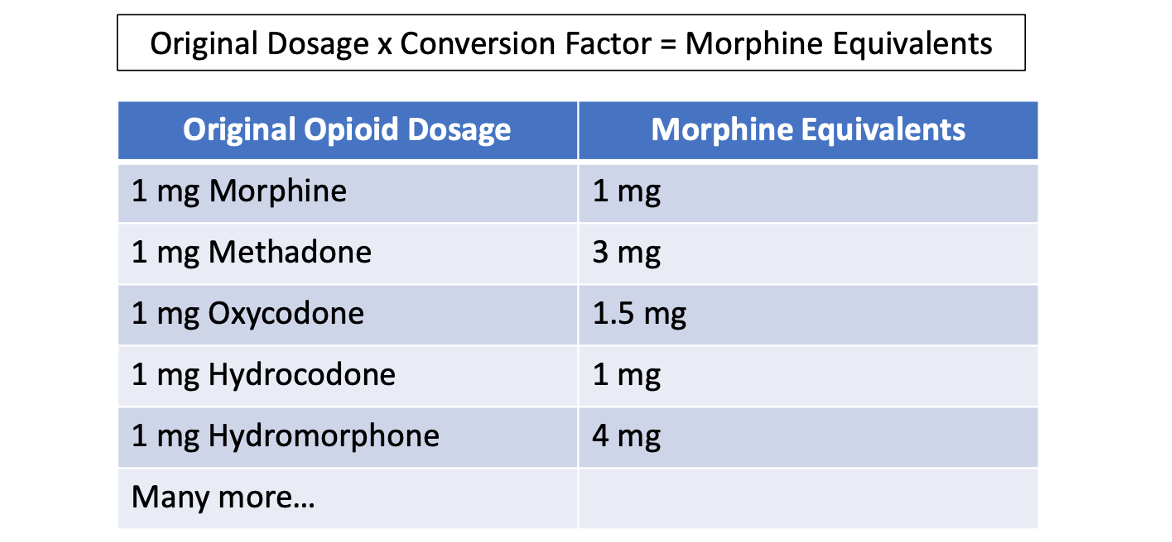
To measure opioid reduction, each patient's morphine equivalents were summed over 24-hour windows at admission, discharge, and weekly intervals (a "week 1" window, for instance, began 7 days after admission). Percent change relative to admission was then calculated for each timepoint. To focus on patients arriving on opioids from acute care, only patients with an opioid administration in the first 24 hours were included.
Results
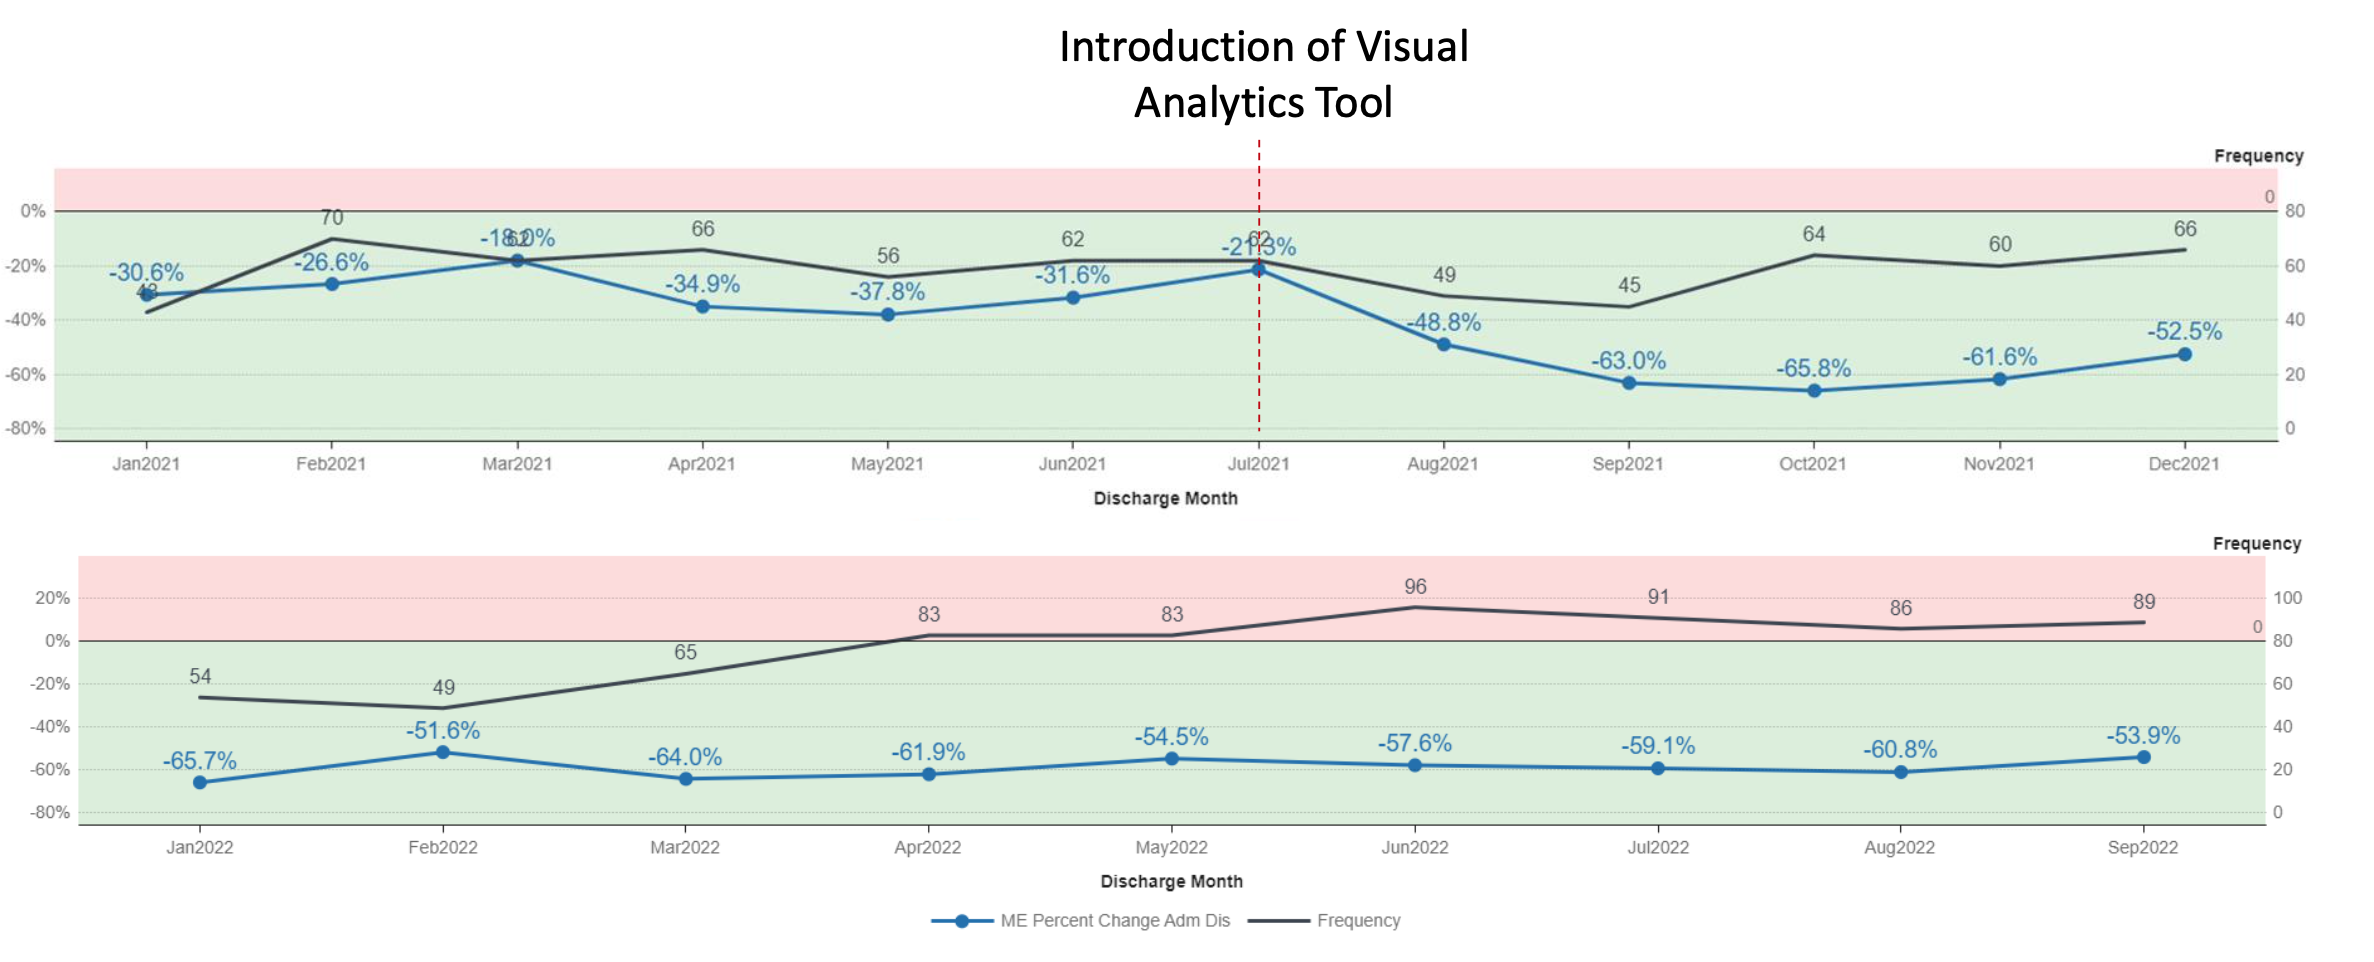
In July 2021, the interactive SAS Visual Analytics tool went live, displaying historical trends and changes in opioid administration for active patients.
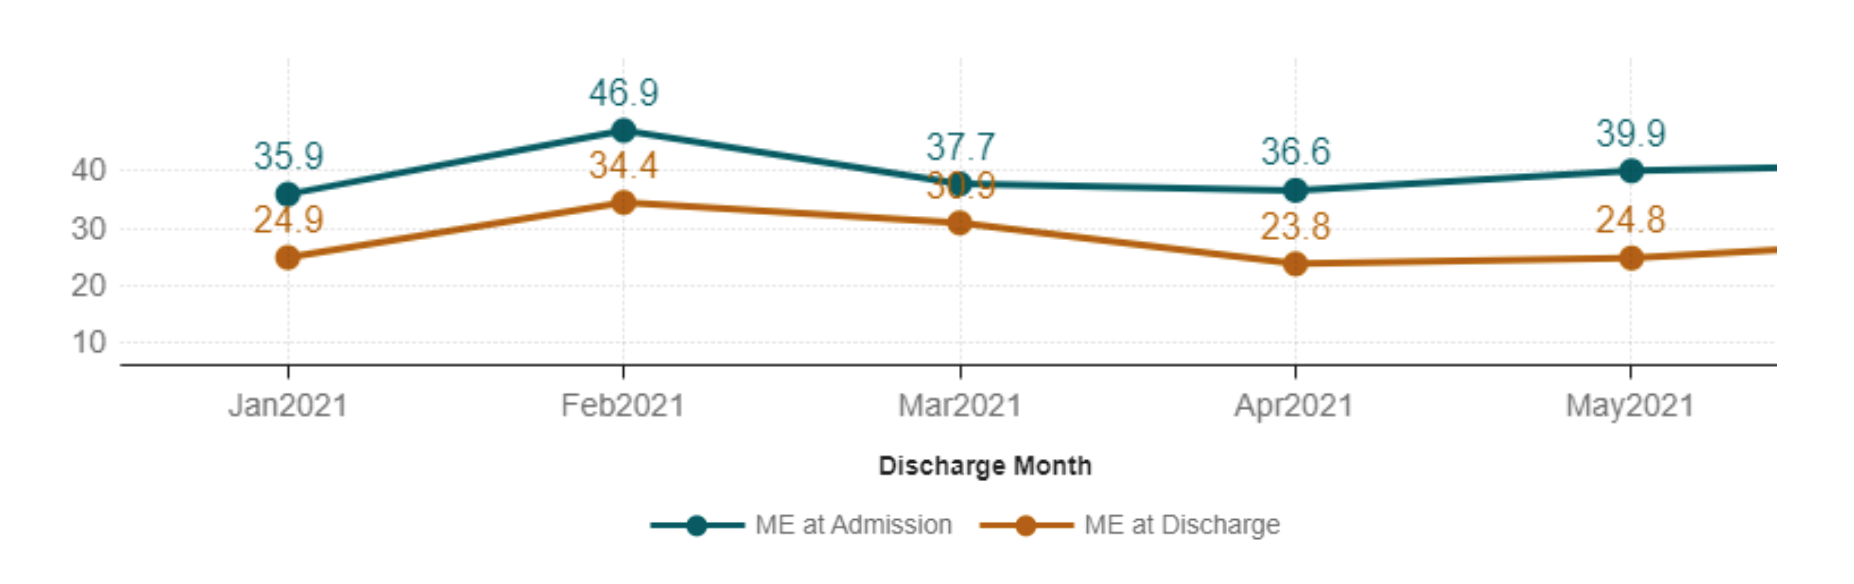
Average morphine equivalents (mg) at admission and discharge
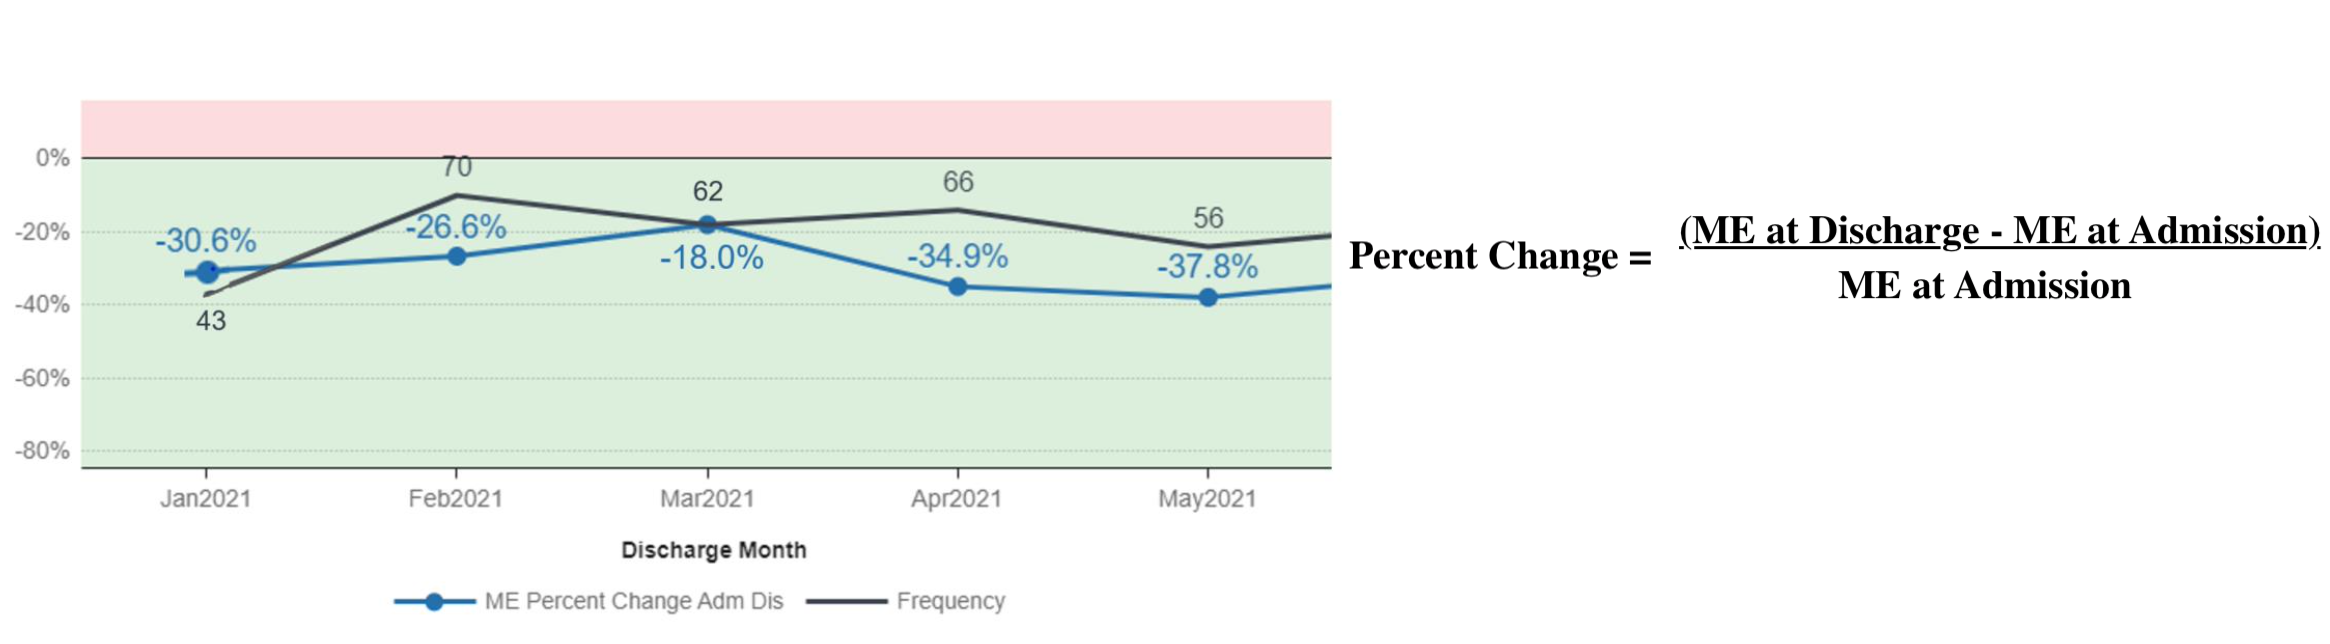
Percent change in morphine equivalents from admission to discharge
The tool has since been adopted by our Multimodal Pain Group to evaluate progress on opioid reduction goals, and it's now part of regular team meetings where physicians, nursing and therapy staff discuss patient pain management and satisfaction.
To evaluate the tool's contribution to opioid reduction, we compared percent reduction in morphine equivalents for the six months before and after implementation using a two-sample t-test.
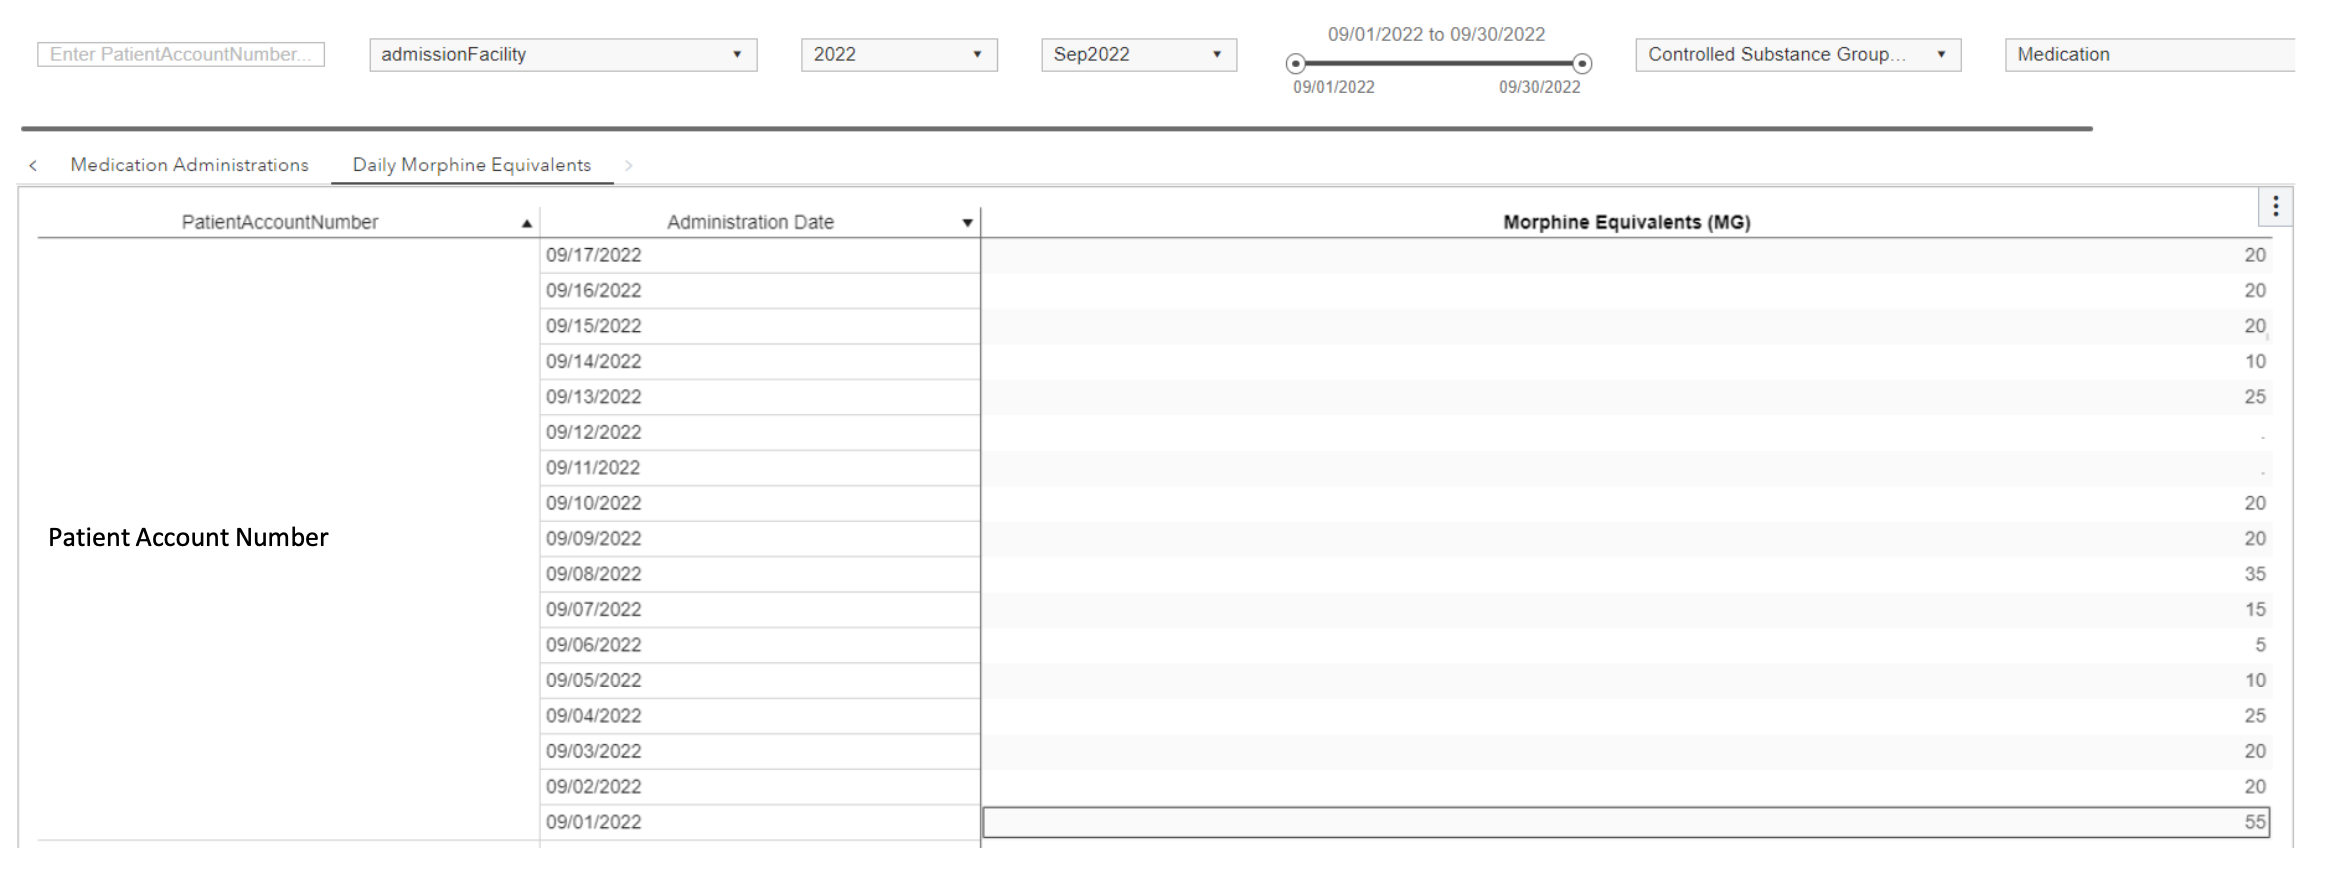
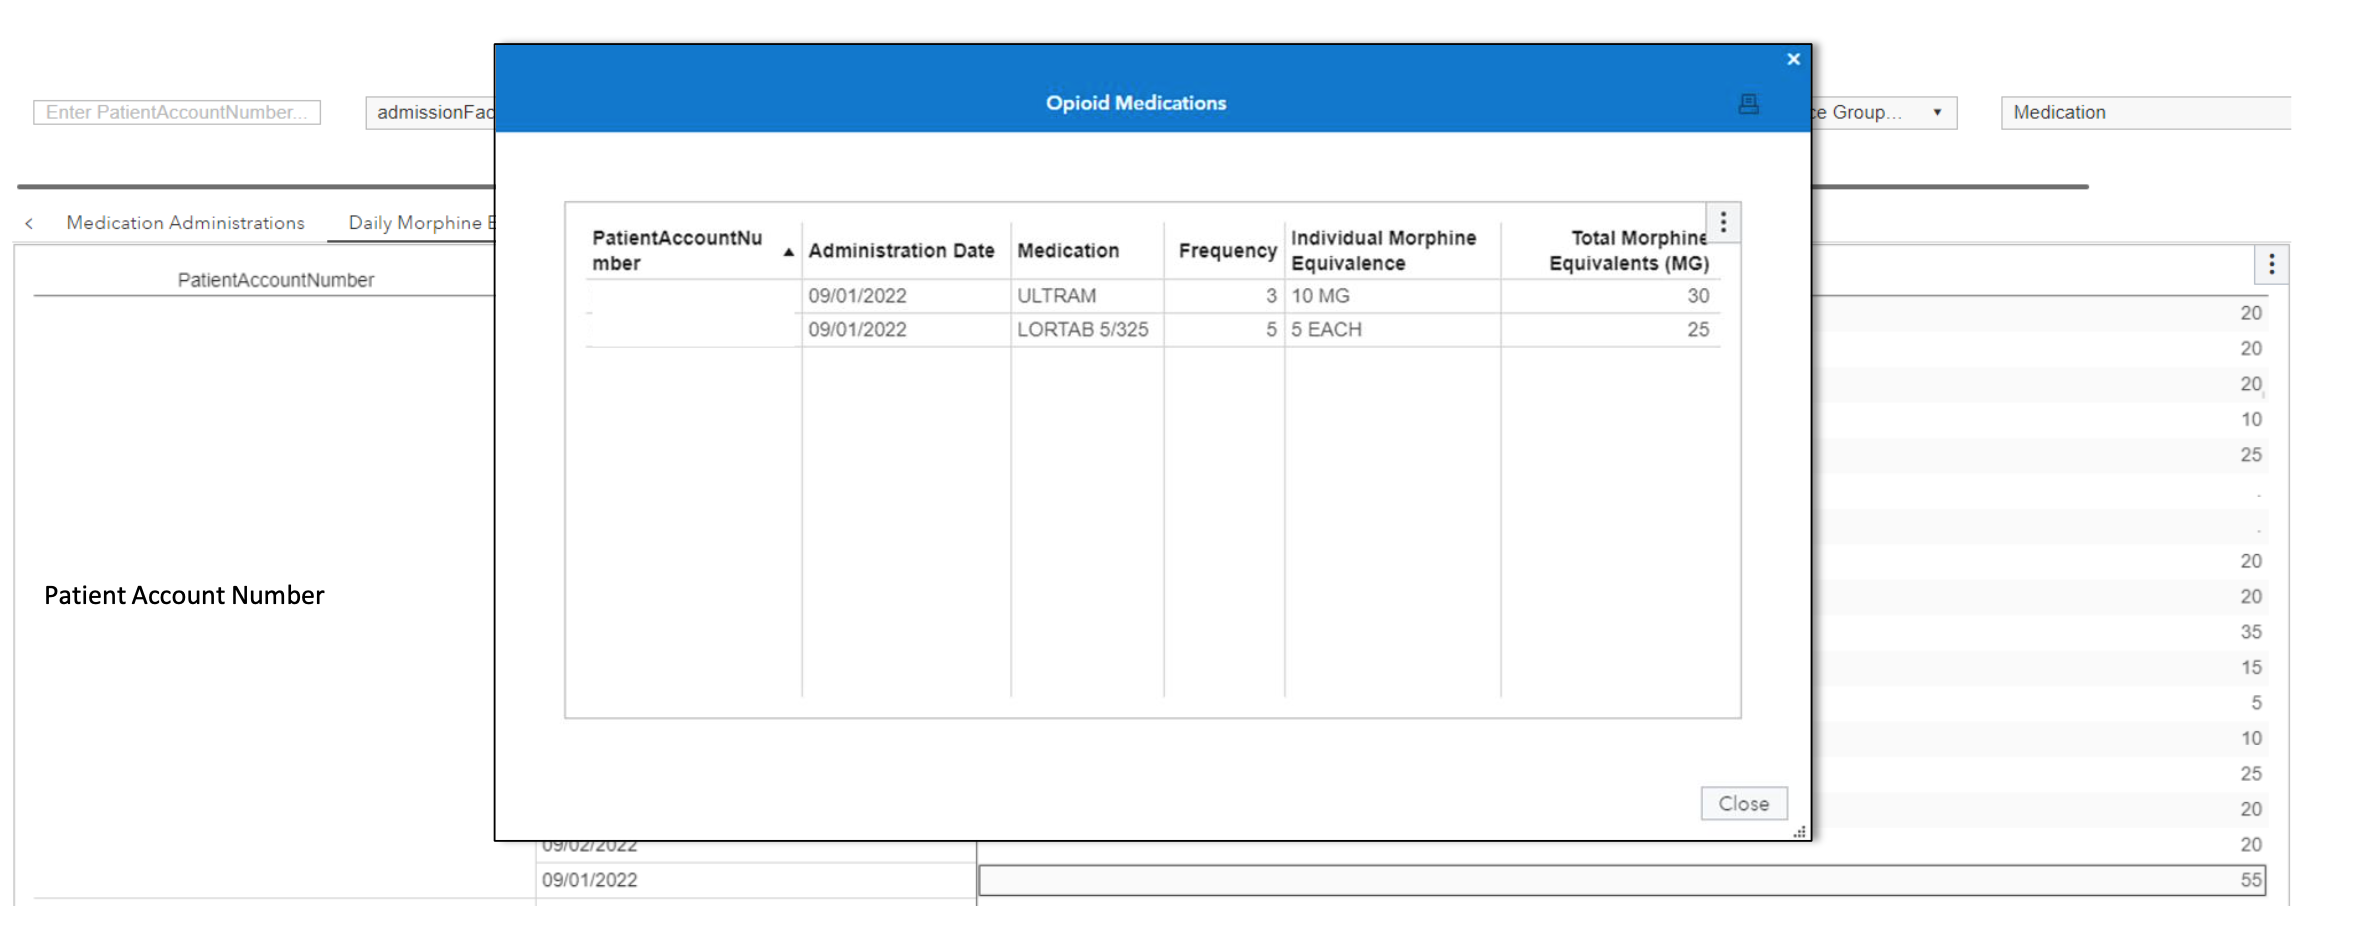
The tool also gives clinicians a patient-level view of daily morphine equivalents and opioid administration, with more detail available when a specific day is selected.
Discussion
This tool gives clinical teams a comprehensive view of the hospital's progress toward reducing opioid administration. Its automated notifications provide physicians with actionable, patient-level data to support clinical decision-making. As new pain management interventions are developed, sound metrics are needed to evaluate their impact on patient care — so beyond its clinical utility, this tool may also support research applications as a measure of opioid administration and reduction.